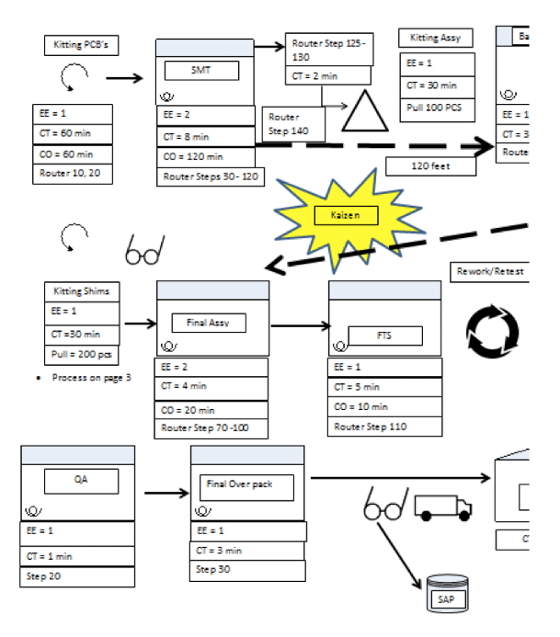
Where would you go to find the critical roadblocks holding you back from success in your production? Try looking at a Value Stream Map (VSM) to begin your journey. The VSM is also referred as the diagram with the cool little symbols and arrows.
The VSM is a map that shows the complete product map from the suppliers to your customer. Along the route you will document the lead times for the materials, transportation type, customs or any other potential delays in receiving the raw materials. Then, the VSM drives its way into the production process.
The VSM in the production process is where the potential becomes unlocked. At each process step you identify the number of employees to complete the step, cycle time at the step, and changeover time during the process step. Please don’t limit your creativity to just these three inputs. You can add or subtract many other key metrics for your production team to follow. Make sure this VSM is detailed showing all of the cure times, oven times, extra process loops, rework, and retest. The next dynamic the VSM will show is the amount of wasted transportation from each step. This is an excellent opportunity to add a Kaizen burst to eliminate wasted motion. Follow and detail your process all the way to your customer’s dock door.
The calculation page is where you study the customers demand, available time, takt time, cycle time, and number of employees. After you have completed your calculations verify that the takt time is under the cycle time for each process step. If you are not balanced then this is your next opportunity for another Kaizen burst. This will eliminate waste, underproduction and help the team level load the process.
Don’t hesitate or be afraid of the symbols and arrows, tackle the problem head on by getting in the game and mapping out your process.


